Key metrics in context
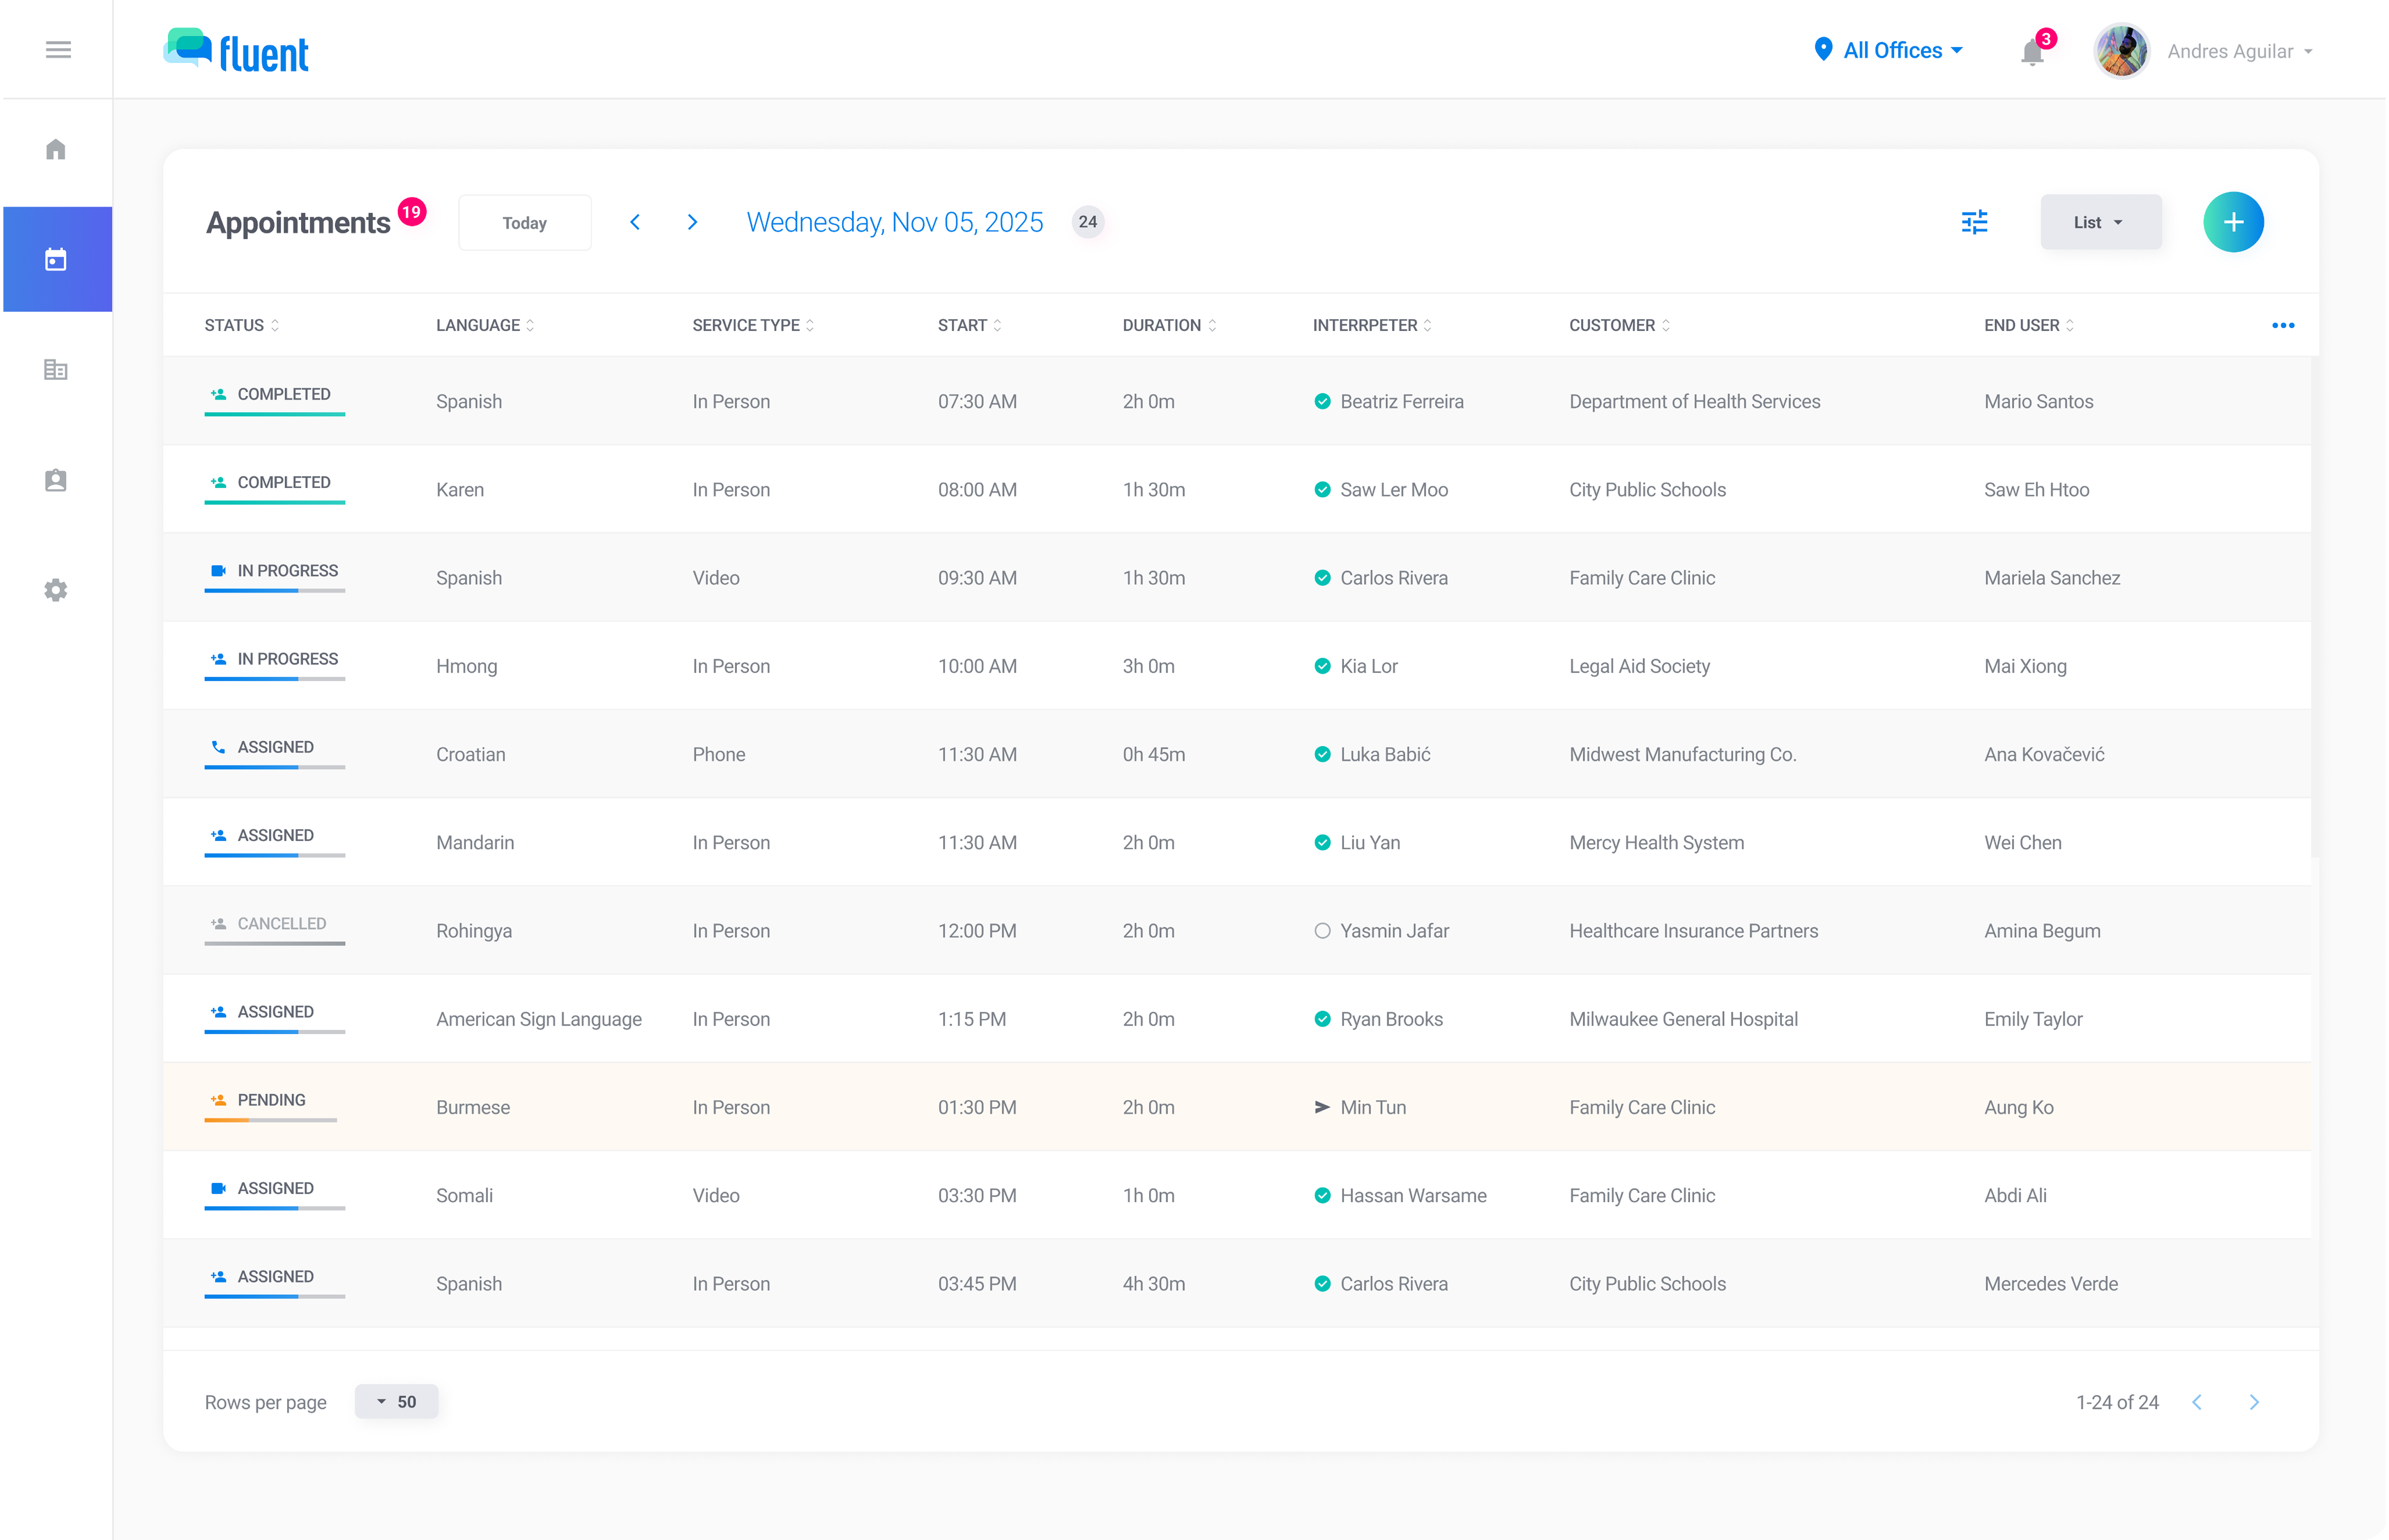
See totals, breakdowns, and trends across interpreter profiles, customer profiles, calendar views, and the reports page.
Track appointments, coverage, languages, customers, and service locations across any time range. Filter in seconds, export with confidence, and share polished snapshots.
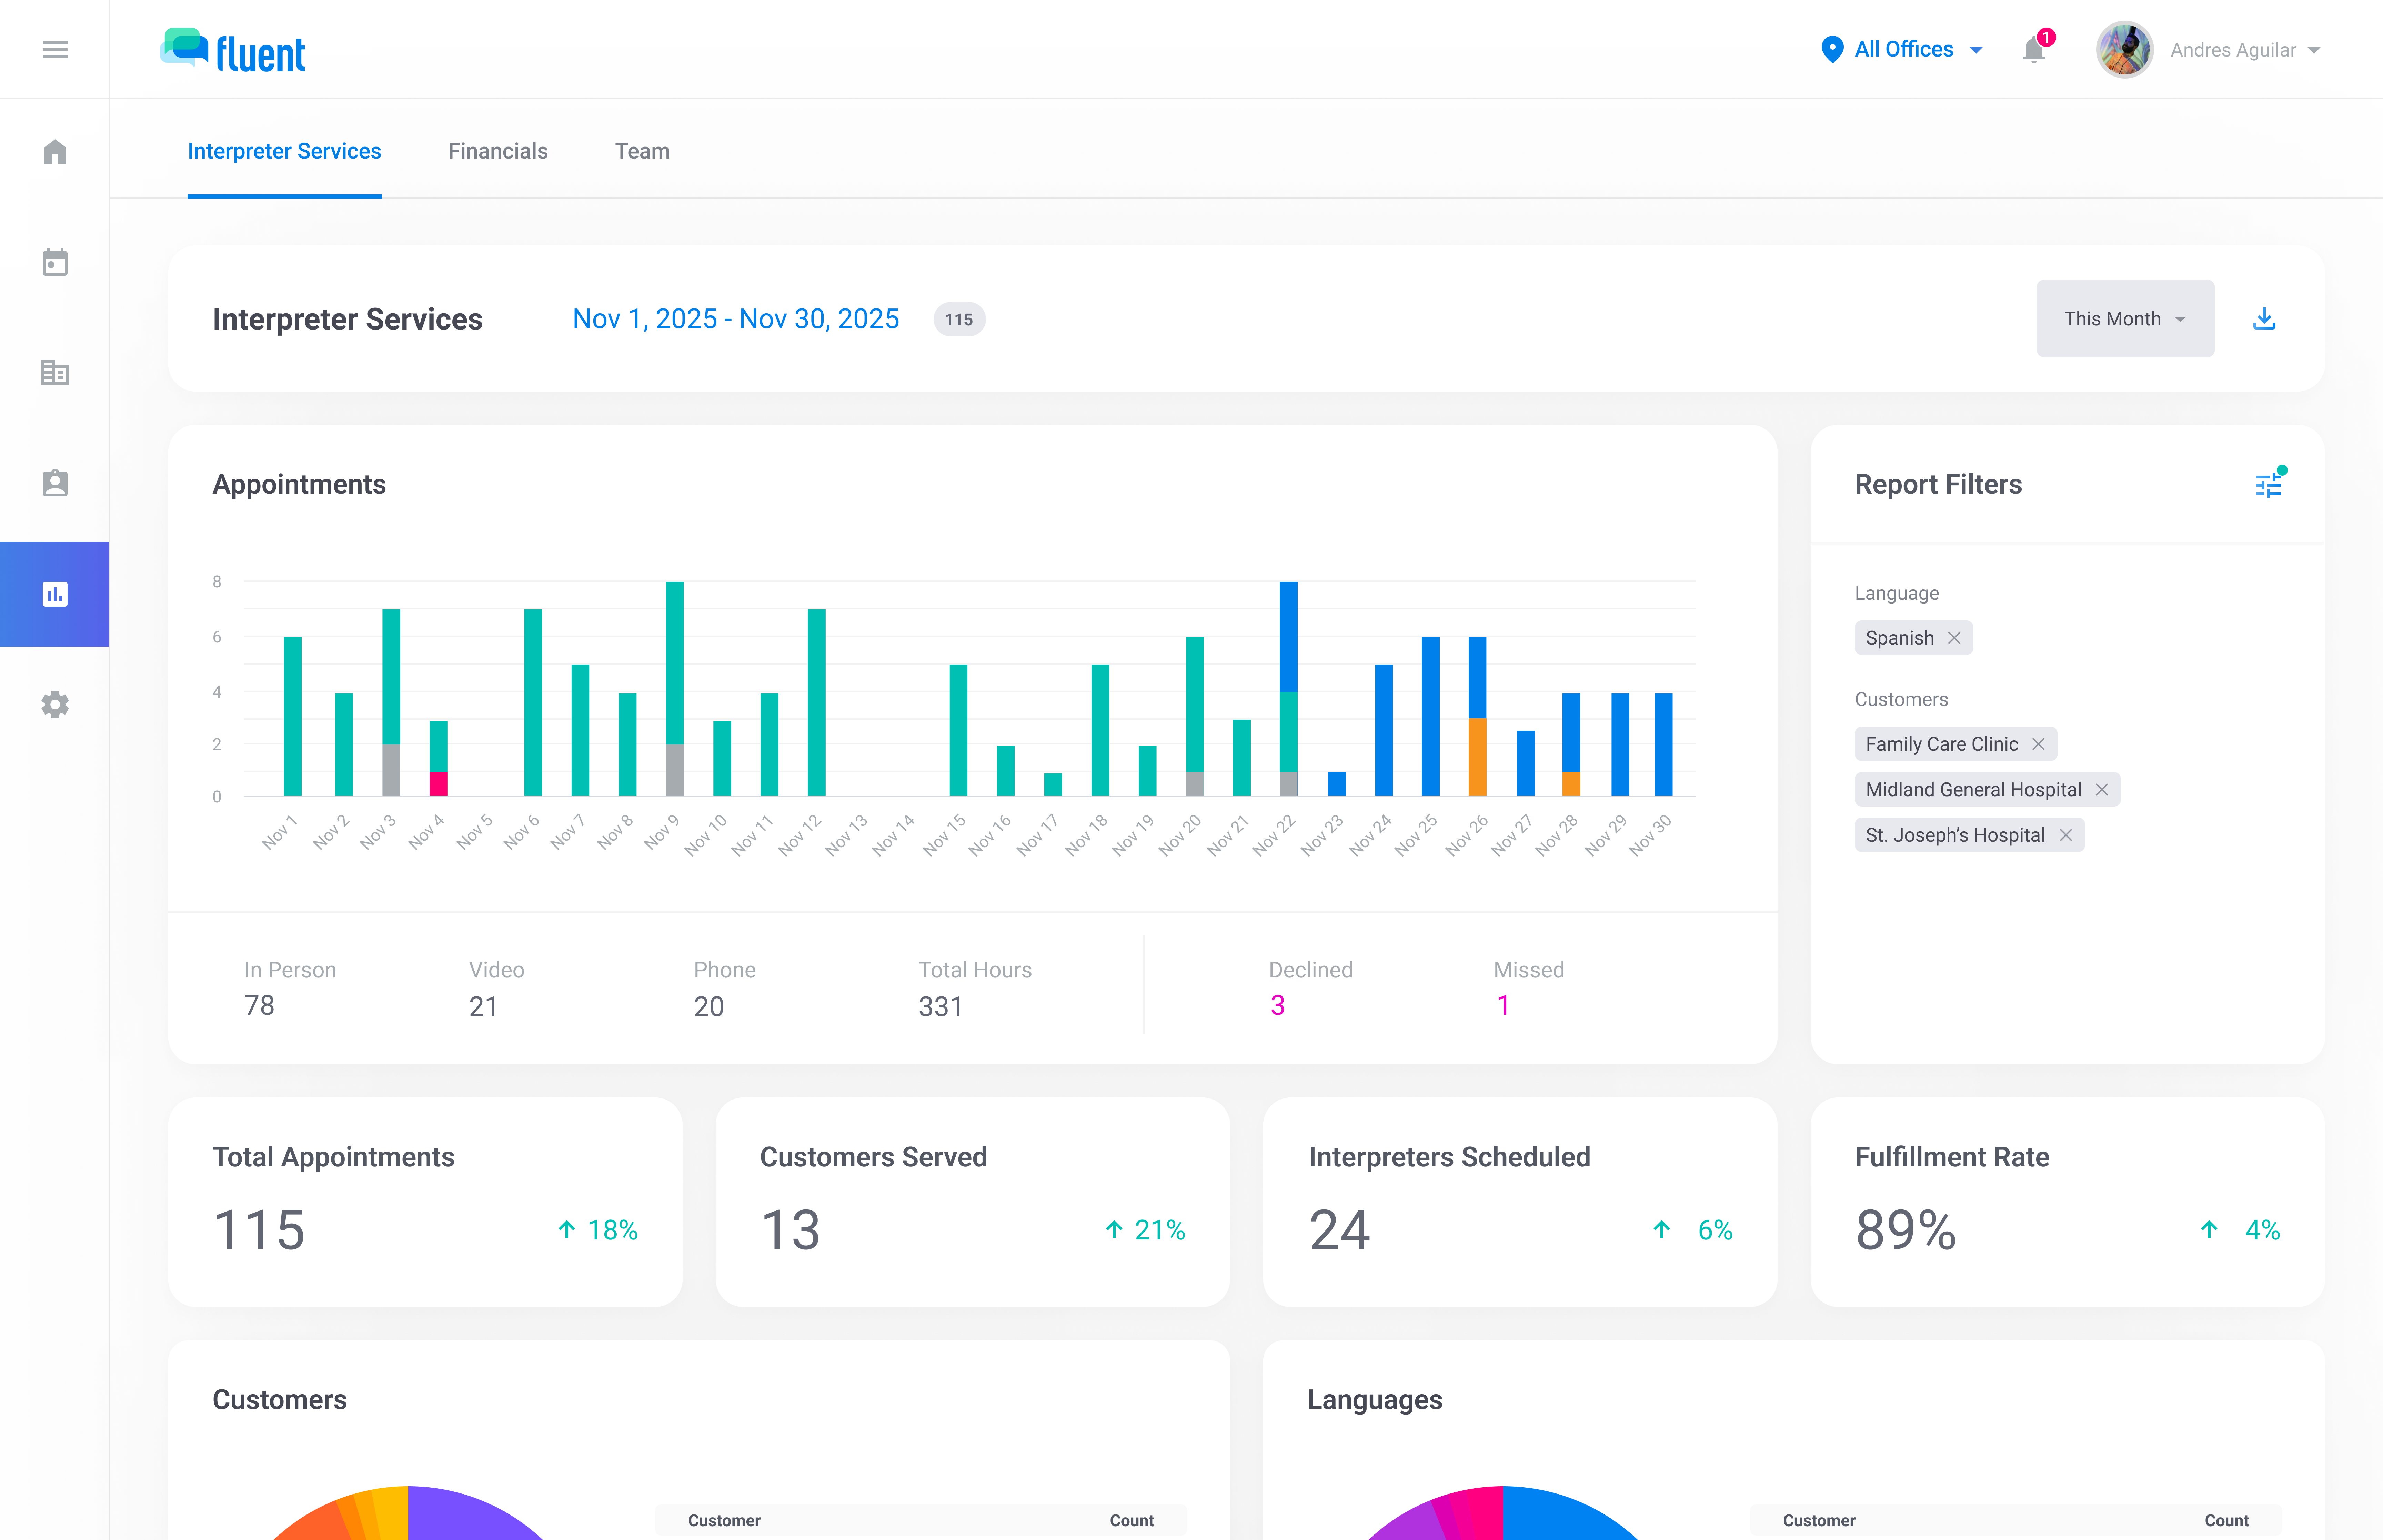
Track the metrics that matter across interpreter services — from performance trends to breakdowns by customer, language, and outcome.
Filter flexibly across the app and click into the numbers behind the trends to understand what's driving volume and patterns.
Export polished PDF reports or MFA-protected CSV files with the right controls in place for sensitive reporting.
Fluent surfaces key metrics throughout the app—from calendar views to profiles to dedicated reports—so you can monitor activity, spot trends, and drill into the customers, languages, teams, and interpreters behind the numbers.
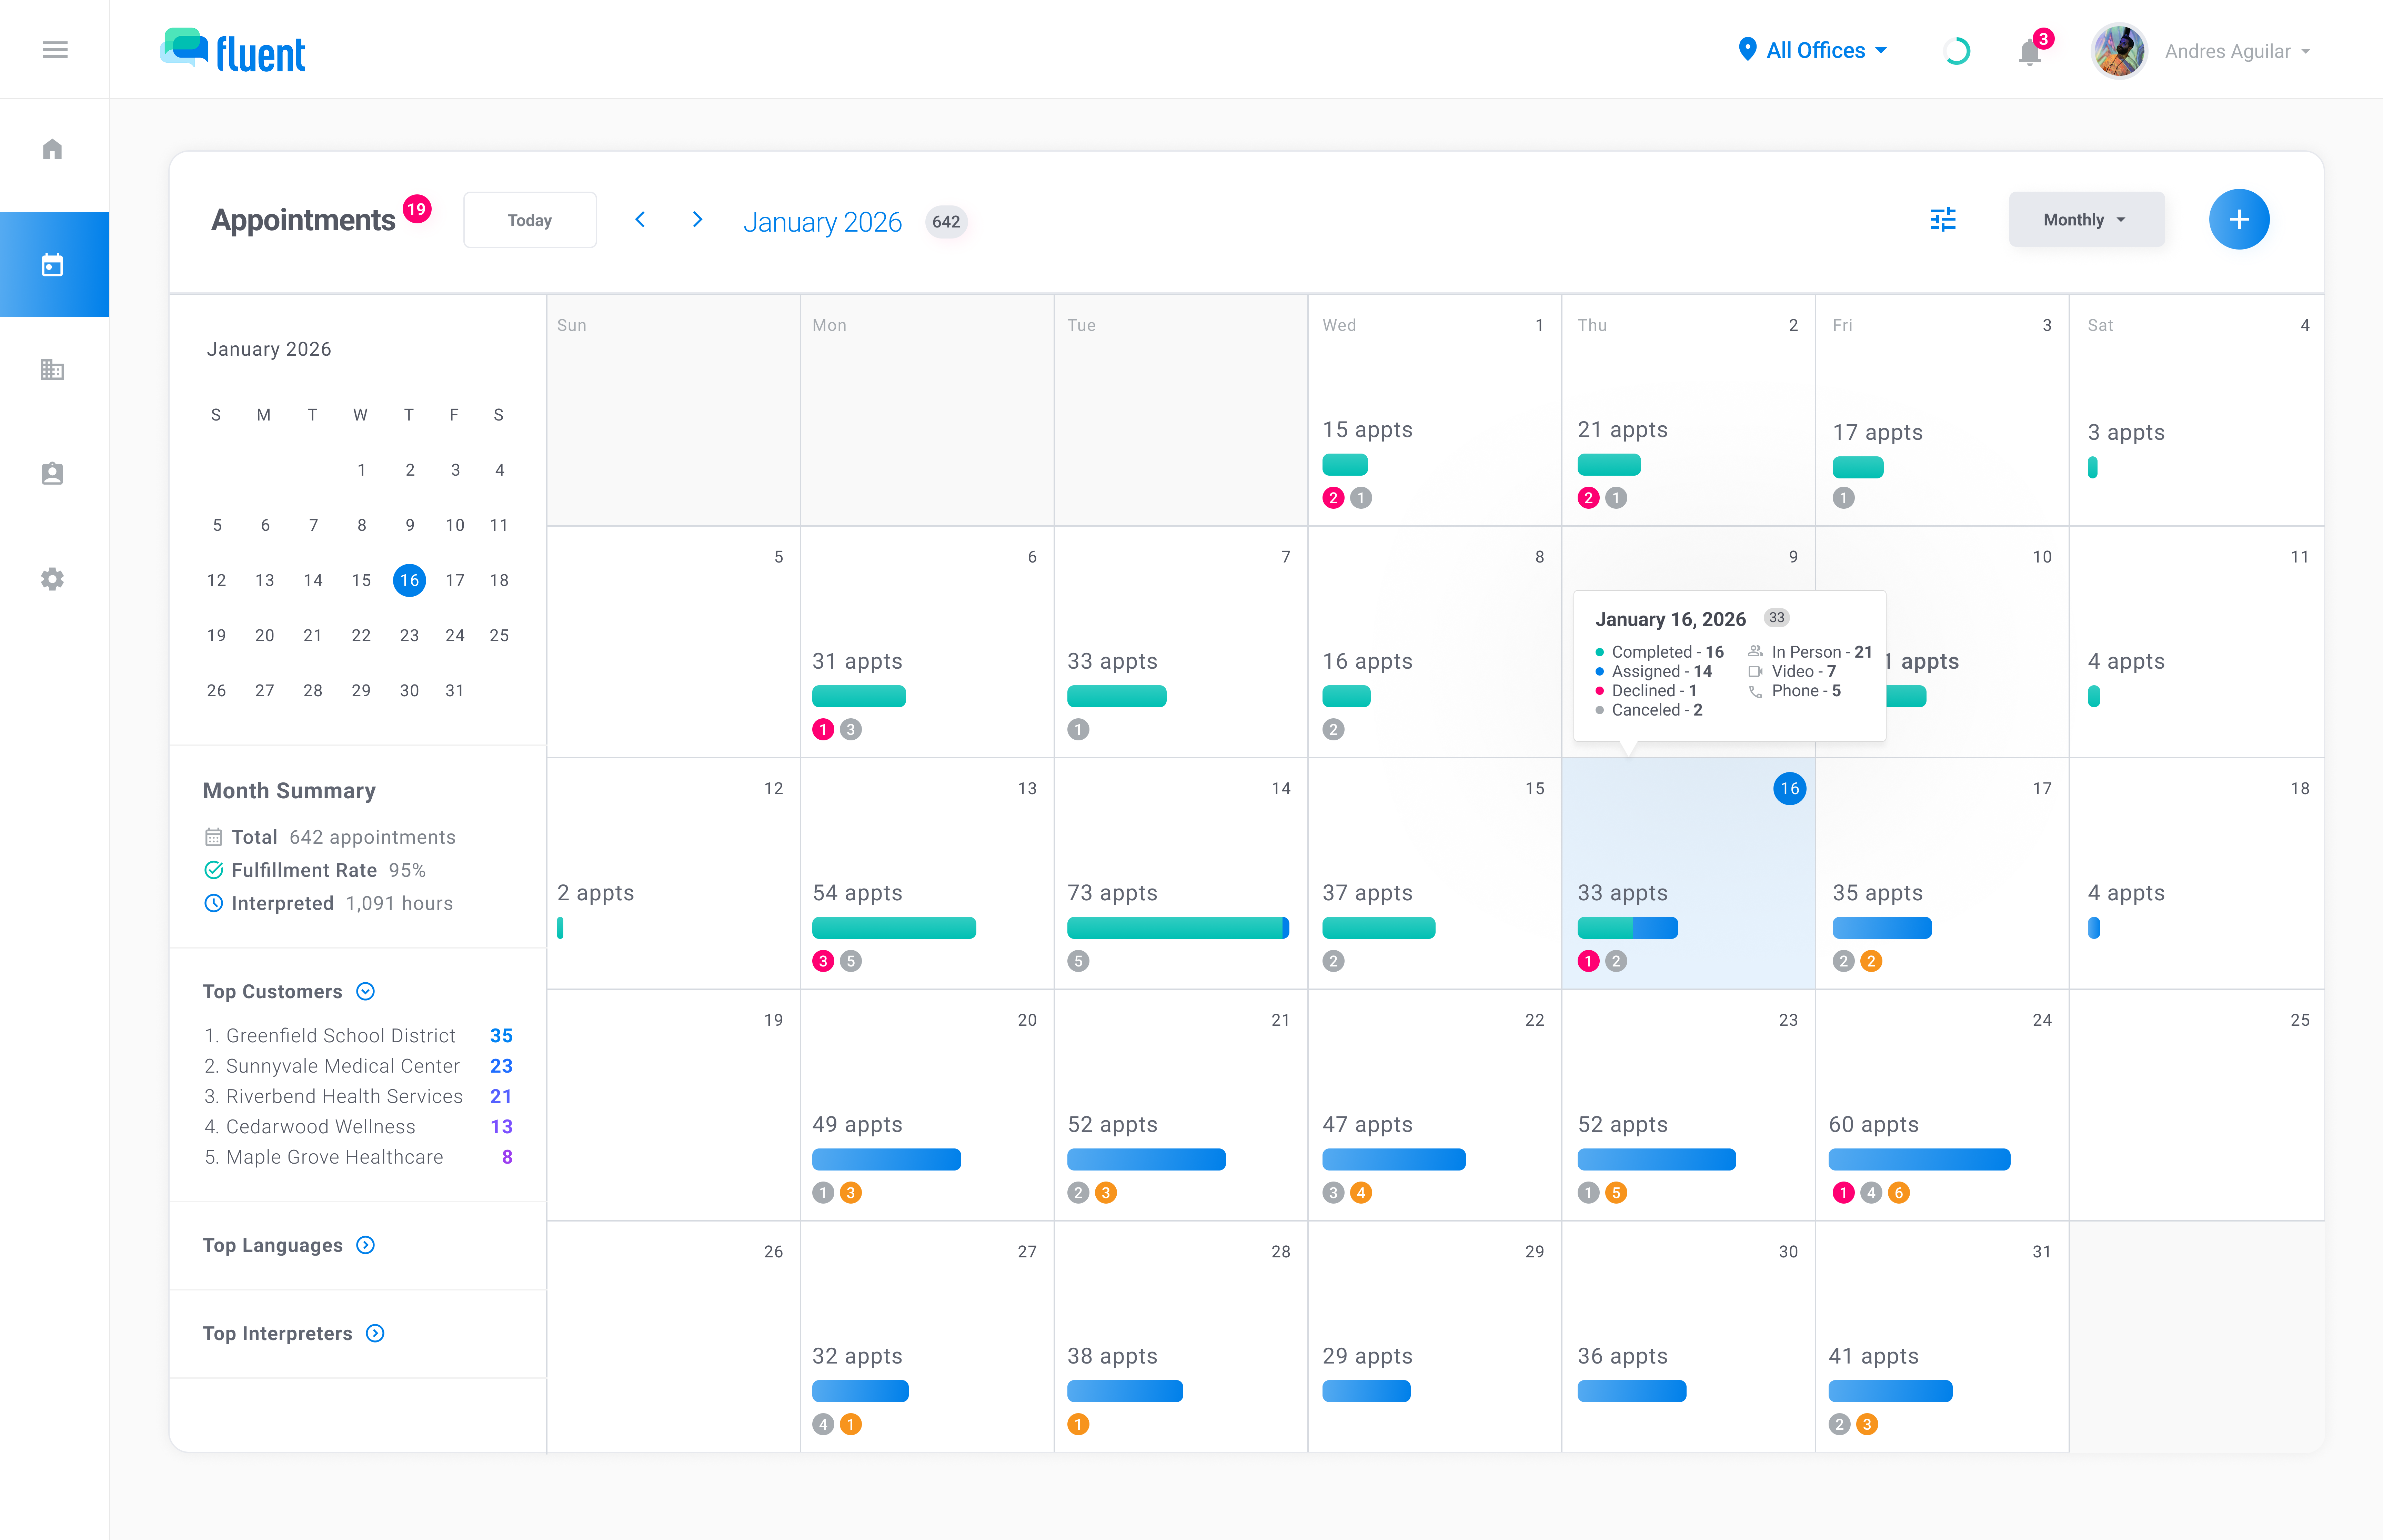
See totals, breakdowns, and trends across interpreter profiles, customer profiles, calendar views, and the reports page.
Explore richer reporting views for performance, volume, coverage, service locations, and operational trends, then export the data when needed.
Jump from top customers, languages, teams, and more into filtered views to quickly explore what is driving the numbers.
Reports stays responsive even when you filter across agencies, offices, customers, interpreters, and languages—so you can answer questions in the meeting, not after it.
Filters apply across every chart—no separate report builder required.
See language demand, customer concentration, and appointment outcomes at a glance—then follow the trail with filters and drilldowns.
Spot high-volume languages and identify shifts in demand over time.
See where appointment volume is coming from and which customers are driving the most activity.
Monitor cancellations, declines, and missed appointments to catch issues before they become patterns.
Map appointment locations to understand geographic coverage, travel patterns, and high-volume service areas.
Generate a PDF report for stakeholders or export CSV data for deeper analysis. CSV exports are protected behind multi-factor authentication.
Create a clean, shareable report for any time range and filter set, complete with charts and summary insights.
Download raw data, choose which columns to include, and export for deeper analysis. Restricted to admin users and protected by multi-factor authentication.
As rates are configured, Fluent will expand reporting to include revenue, interpreter pay, and cost trends—plus dashboards that highlight staffing gaps and performance patterns.
We'll walk you through how dashboards, filters, and exports work together.